2026
52.88 million NRSF forecast new supply


Market Intelligence/Self Storage
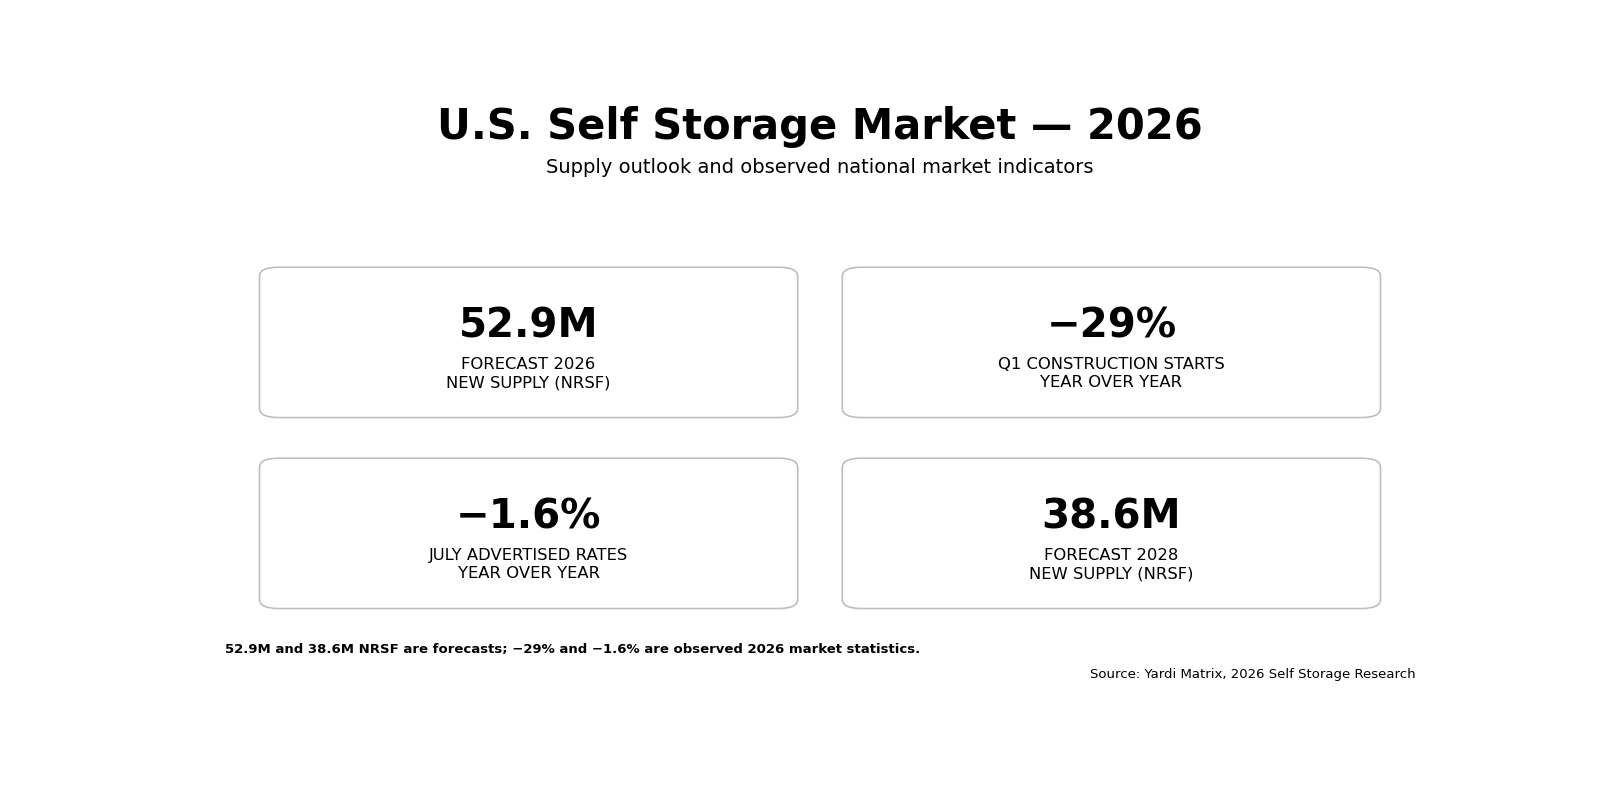
52.9 MILLION SQ. FT.
Forecast U.S. Self Storage New Supply — 2026
Yardi Matrix's Q2 2026 supply forecast estimates approximately 52.88 million net rentable square feet of new U.S. self storage supply in 2026.
The figure reflects a substantial existing construction pipeline entering 2026 rather than an acceleration in new development activity.
Source: Yardi Matrix, Self Storage Supply Forecast Update, Q2 2026
Read Original Research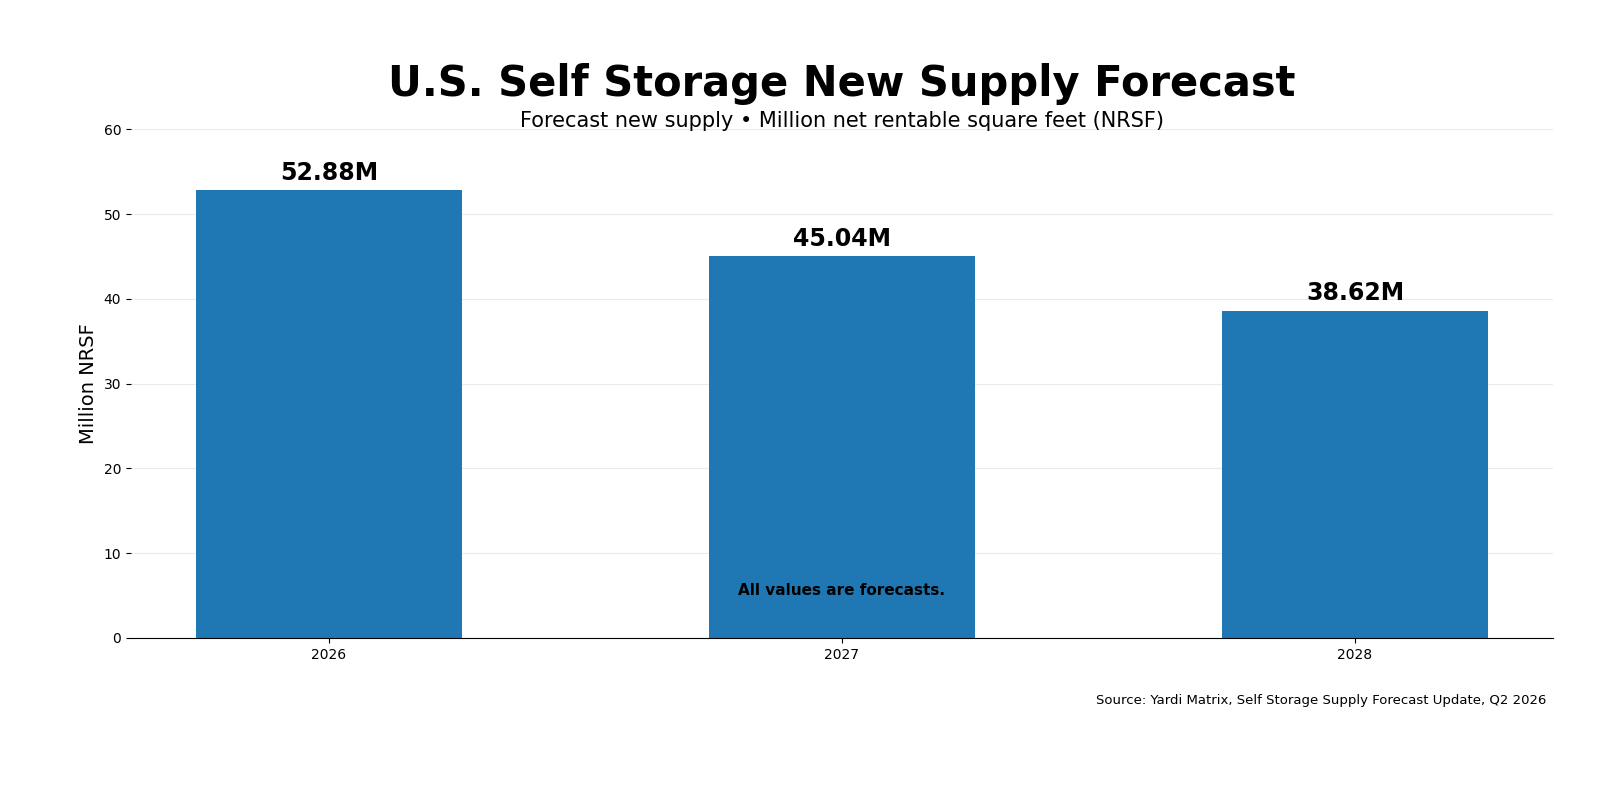
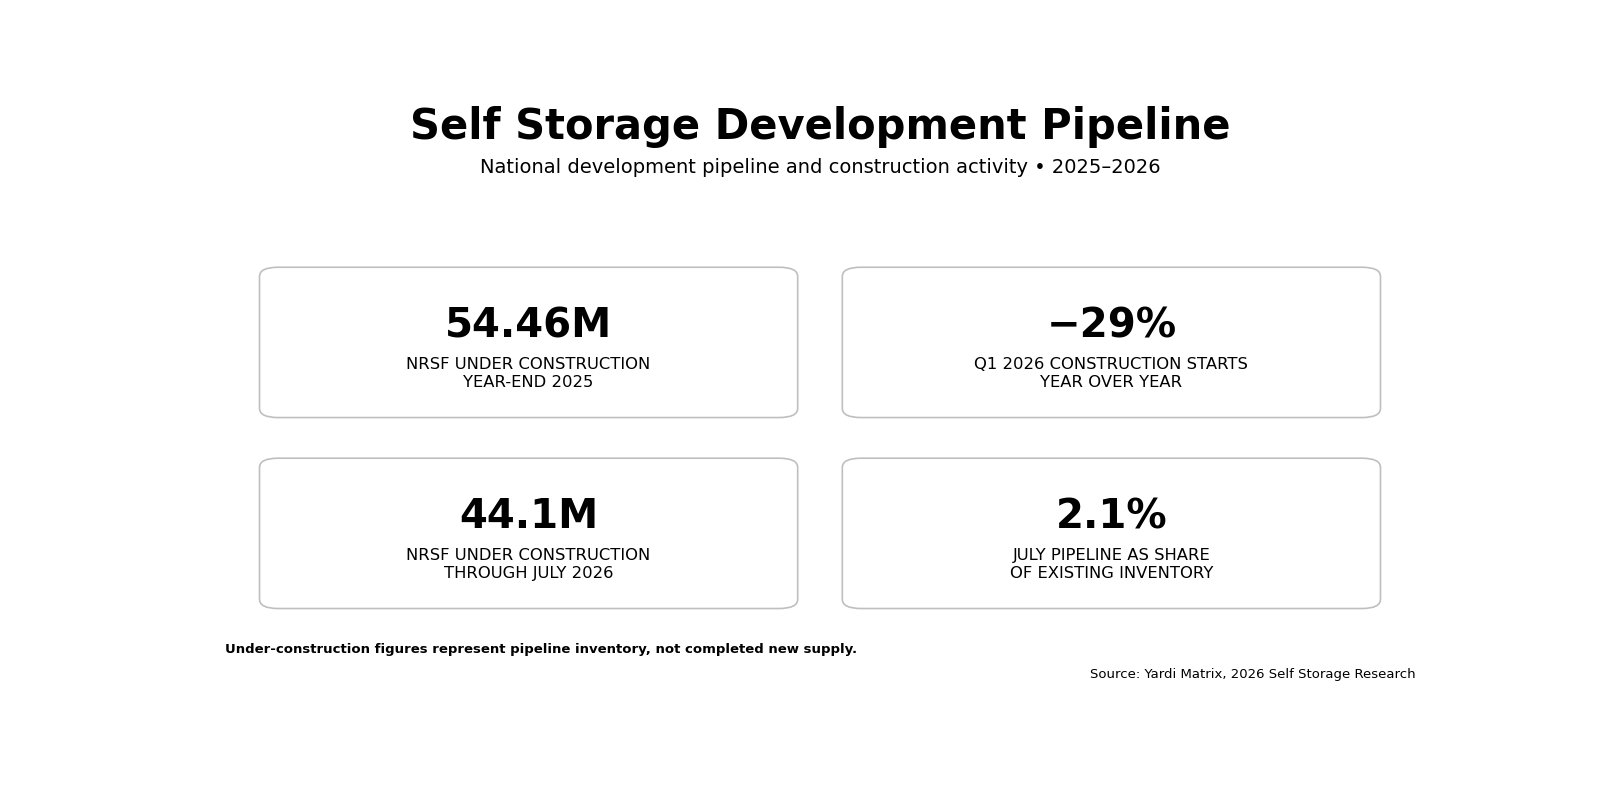
54.46 MILLION SQ. FT.
Year-End 2025 Under-Construction Pipeline
Approximately 54.46 million net rentable square feet of self storage inventory was under construction nationally at year-end 2025.
Construction completion timelines led Yardi Matrix to forecast that most, but not all, of this inventory would be delivered during 2026.
Source: Yardi Matrix, Q2 2026
−29%
Year-Over-Year Change in Construction Starts — Q1 2026
U.S. self storage construction starts during Q1 2026 were approximately 29% below the pace recorded one year earlier. Yardi Matrix reports that the decline indicates the contraction in new construction that began during 2025 continued into 2026.
Source: Yardi Matrix, Q2 2026
52.9M → 45.0M → 38.6M SQ. FT.
Forecast New Self Storage Supply
2026
52.88 million NRSF forecast new supply
2027
45.04 million NRSF forecast new supply
2028
38.62 million NRSF forecast new supply
Yardi Matrix forecasts a significant decline in annual new supply as the current development pipeline works through the market. Forecast 2028 new supply represents approximately 1.72% of existing national stock.
Source: Yardi Matrix, Self Storage Supply Forecast Update, Q2 2026
−1.6%
National Advertised Rate Change — July 2026
National self storage advertised rental rates were approximately 1.6% lower year over year in July 2026.
Recent supply continues to influence pricing, although the pace of new deliveries and the development pipeline have begun to slow.
Source: Yardi Matrix, Self Storage National Report, August 2026
View Current Self Storage Research2.1% OF EXISTING INVENTORY
National Under-Construction Pipeline — July 2026
Approximately 44.1 million net rentable square feet of self storage space remained under construction nationally through July 2026.
That pipeline represented approximately 2.1% of existing inventory.
Trailing 12-month deliveries represented approximately 2.4% of inventory, and all of Yardi Matrix's top 30 metros had experienced a decline in trailing 12-month supply since the beginning of 2026.
Source: Yardi Matrix, August 2026
GRADUAL AND UNEVEN RECOVERY
Balanced National Market Outlook
Yardi Matrix entered 2026 expecting self storage recovery to be gradual and uneven as weak housing turnover, recent supply additions, and elevated financing costs continued to influence demand and development.
By mid-2026, occupancy trends had shown some improvement, while advertised rental rates remained below prior-year levels.
The development pipeline, however, continued to contract.
Source: Yardi Matrix, 2026 Self Storage Research
DIVERGENT LOCAL PERFORMANCE
High-Level Texas Market Context
Yardi Matrix's 2026 research demonstrates that self storage performance varies significantly by metropolitan area and local supply conditions. Texas markets are part of this broader pattern. Some markets have experienced pressure from recent Sun Belt supply additions, while others have shown periods of improving advertised-rate performance as new inventory is absorbed.
Source: Yardi Matrix, 2026